Before I get to the mission ‘impossible’ I want to highlight another recent study which demonstrated just how extremely unlikely/impossible the maximum daytime temperatures recorded during the North West Pacific heatwave of 2021 were, if one assumes that the sole/primary driver of the conditions was ‘climate change’, i.e. the long term warming trend observed since 1950 or even 1850, depending on which temperature datasets are used.
Here is what that paper says:
Here, we identify and draw on the strong relationship between the climatological higher-order statistics of temperature (skewness and kurtosis) and the magnitude of extreme events to quantify the likelihood of comparable events using a large climate model ensemble (Community Earth System Model version 2 Large Ensemble [CESM2-LE]). In general, CESM2 can simulate temperature anomalies as extreme as those observed in 2021, but they are rare: temperature anomalies that exceed 4.5σ occur with an approximate frequency of one in a hundred thousand years.
Even using a ‘very hot’ climate model with an extraordinarily high climate sensitivity of 5.3C, these researchers could still only simulate the heatwave as a 1 in a 100,000 year event! In other words, they found that it was basically impossible, or, to put it more eloquently, it was a 5 sigma ‘Black Swan’ event which could not be linked to climate change.
The authors inform us as to the meteorological proximal cause of the extraordinary heatwave:
The proximal, meteorological causes of the heatwave are relatively clear. Around June 20th, a circulation anomaly developed in the western subtropical Pacific due to convection associated with the East Asian monsoon system (Qian et al., 2022). This perturbation seeded a Rossby wave train, which propagated eastward along a midlatitude wave guide, and modified the upper tropospheric winds associated with the wave guide as it progressed. By June 25th, an omega-block had developed over the PNW, which progressed eastward and intensified over the course of the heatwave (Neal et al., 2022; Philip et al., 2021). A cross-Pacific atmospheric river also transported latent heat into the region (Mo et al., 2022). The block caused an extended period of clear skies, increased solar radiation at the surface, and subsidence, all of which increased temperatures. Further, downslope winds from the Cascades and other mountain ranges were reported (Philip et al., 2021), causing additional heating. Similar causal factors have previously been identified for PNW heatwaves in general (Bumbaco et al., 2013; Qian et al., 2022); the difference for this heatwave was with respect to magnitude. The geopotential height anomalies associated with the omega-block were found to exceed those in any prior heatwaves within the period of the ERA5 record (Philip et al., 2021), and daily maximum temperatures at some locations exceeded prior records by 5–6°C (Overland, 2021; Philip et al., 2021).
The authors then tell us how this heatwave was intensified by a general summertime warming of the area in line with a more general warming of the planet (allegedly due to human influence):
The meteorological causal factors for the heatwave occurred on top of a changing mean state due to human influence on the climate system. Summertime daily maximum temperatures in the PNW have increased by 0.24°C per decade since 1960 (based on Berkeley Earth data; Rohde et al., 2013), or about 1.5°C in total over that period. Changes in the mean state alone will increase the probability, intensity, and duration of heat waves (Meehl & Tebaldi, 2004); this shift is a well-understood consequence of climate change. However, the magnitude of the temperatures during the PNW heatwave have raised the question of whether the probability of very extreme events is changing faster than would be predicted by a change in the mean. This hypothesis is not supported by a prior analysis of trends in the 50th and 95th percentiles of station data during peak summer from 1980 to 2015 (McKinnon et al., 2016), but results could differ for the most extreme events, and/or for the early summer period during which the PNW heatwave occurred. Similarly, Philip et al. (2021) did not find evidence of dynamical changes in climate models that would lead to increased probability of very hot extremes, but intriguingly also found that a nonstationary generalized extreme value (GEV) distribution fit to data through 2020 (i.e., not including the 2021 event) predicted that the probability of the 2021 event was zero (Philip et al., 2021). Could this result suggest that the 2021 event was truly drawn from a different distribution?
It is pointed out that daily maximum extremes increase along with the increase in the mean but there was no evidence to suggest that extreme high temperatures were increasing faster. It is also pointed out again that the probability of the 2021 PNW heatwave is zero, after applying a statistical GEV analysis. So, the super hot climate model predicts that the observed event might be expected to happen just once in a hundred thousand years and the statistical analysis concludes that the event was statistically impossible. But of course it happened. Ergo, we must conclude that it was in fact a ‘Black Swan’ or some other factors – such as land use changes, urbanisation, changes in meteorological dynamics, temperature corruption due to poor siting of stations – singularly, or in combination, caused the observed heatwave. The authors opt for the ‘Black Swan’ or ‘bad luck’ explanation:
Assuming a similar event does not occur in the near future, and without a clear physical link to climate change, the most likely explanation remains that the weather event itself was “bad luck.” While climate change added additional warming to the picture (approximately 1.5°C since 1960), the event would have been severe even without the climate change signal
Obviously, this conclusion will not sit well at all with the climate cultists, whose Mission Impossible is to link all such extreme heatwaves to climate change, even when they are impossible!
Enter our intrepid and oddly named trio from Columbia University, NY: Samuel Bartusek, Kai Kornhuber, and Mingfang Ting!
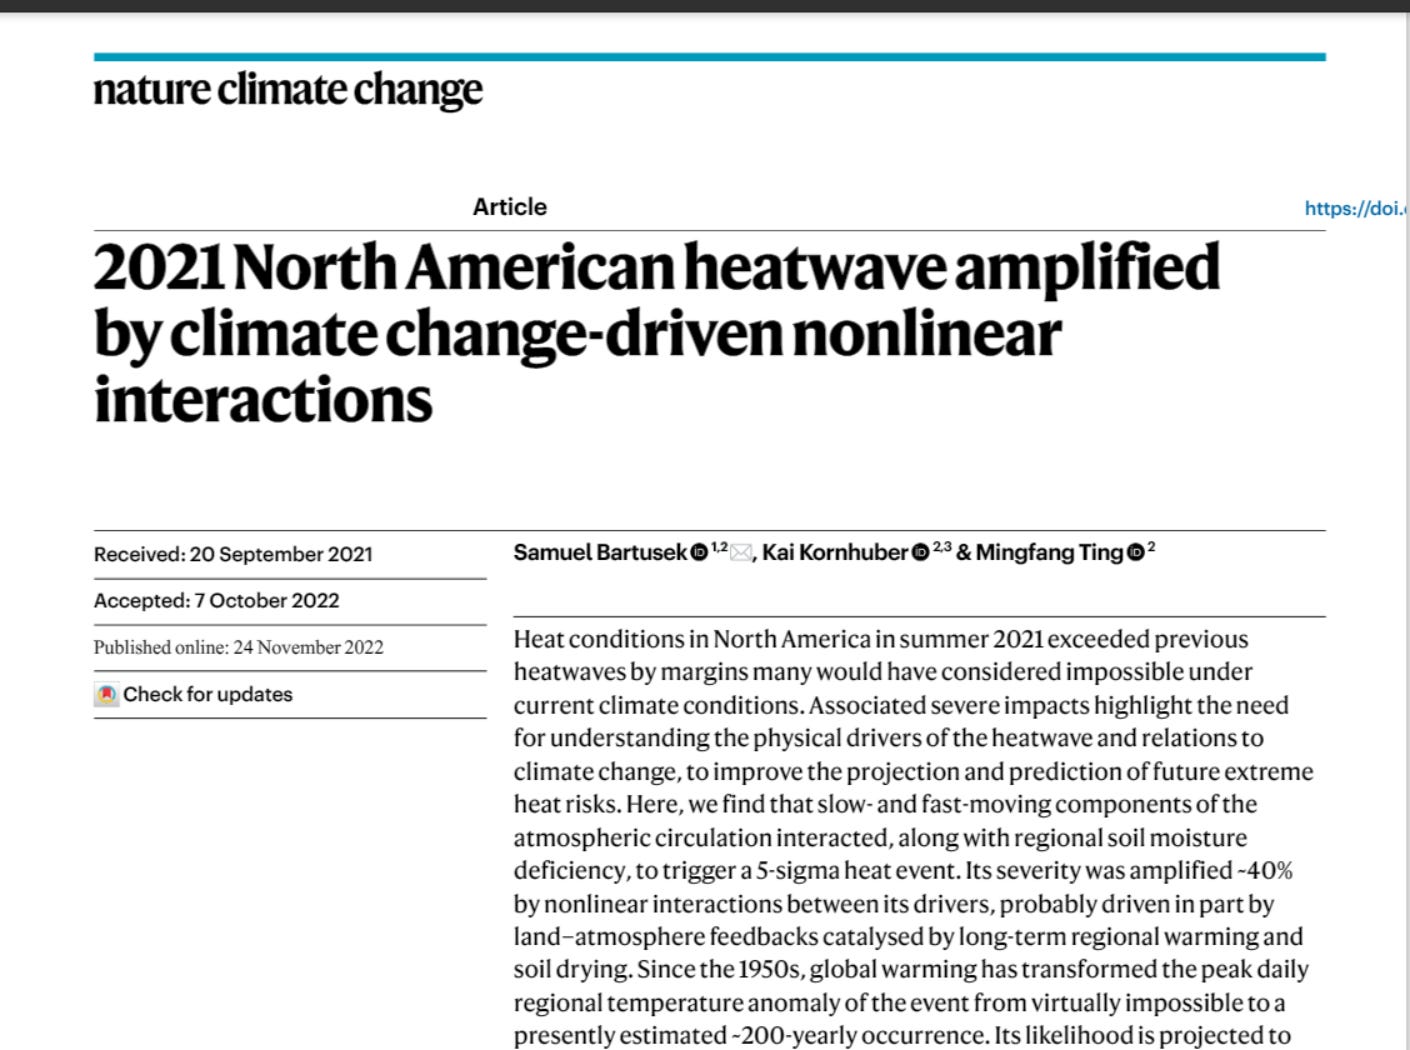
Even as global warming increases the severity and frequency of heatwaves, the magnitude of this event exceeded what many may have considered plausible under current climate conditions. While heat records are typically broken by small increments, this event shattered records by tens of degrees Celsius. Such an unprecedented event raises the pressing question of whether future projections of heat extremes are too conservative or their mechanisms inadequately captured by climate models. It is therefore important to understand the physical drivers of the event and assess their connections with climate change.
You see what they did there? They didn’t say ‘assess their possible connections with climate change. They anticipate the results of their own study even before presenting it. This sentence tells us that they will find a link to climate change – and they do, of course. The authors here, as in the previous study above, also outline the proximate causes, specifying atmospheric dynamics, plus dry soil:
The proximate causes of the heatwave were extreme anomalies in common heatwave drivers—high geopotential height (resulting from wave–wave interaction; Extended Data Fig. 1) and dry soil, which both exceeded their historical (1979–2020) ranges yet largely followed expected bivariate distribution relationships (Fig. 2a–c), as in simulated record-shattering heatwaves in similar regions. However, the peak temperatures of the heatwave markedly exceeded the linear regressions of temperature against geopotential height or soil moisture (by 4–5 °C), which are otherwise strongly predictive (Fig. 2a,b).
But even geopotential height (atmospheric pressure basically) and soil aridity fail to explain the severity of the observed event. So the authors conclude that there must be some non-linear drivers at work:
A multiple regression incorporating their simultaneous anomalies, confirms nonlinear temperature amplification maximizing during the peak of the event at ~3 °C (increasing ~7 °C by ~40%), an ~3σ amplification (Fig. 2c,d). Temporally, this amplification term behaved out-of-phase with geopotential height but in-phase with soil moisture (it increased as soils continued to dry despite declining geopotential height; Figs. 2d and 1d and Supplementary Fig. 4), raising the possibility that two-way soil moisture–temperature interactions contributed to these nonlinearities.
So, the authors are suggesting/stating that the event at its peak was amplified 3σ (from a 2σ event to a 5σ ‘Black Swan’ event) by soil moisture-atmosphere interactions. That’s their theory, which then allows them to claim that climate change contributed very significantly to the ‘impossible’ temperatures via the alleged long term impact of drying soils in the region. But they do at least acknowledge that atmospheric dynamics played an “important role” in the event.
A wavenumber-4 upper atmospheric circulation anomaly (Methods) was established since 19 June (before the heatwave) and strongly amplified (>1.5σ ) since 21 June (Fig. 1d and Extended Data Fig. 1). Accordingly, in late June the jet stream assumed a persistent ‘wavy’ configuration with strong meridional wind meanders (Extended Data Fig. 1 and Supplementary Fig. 2)—exhibiting a zonal-mean wind and temperature fingerprint for amplified planetary scale waves that some evidence suggests may become more frequent with warming. Further, convection in the western subtropical Pacific may have helped excite a late-June Rossby wavetrain extending towards North America that locked phase with the existing hemispheric wave, amplifying the geopotential height and temperature anomalies in the PNW and perhaps also strengthening the hemispheric wave (Extended Data Fig. 1), suggesting an important role for atmospheric dynamics in this event.
But, they claim that soil moisture anomalies caused by long term warming (climate change) amplified the heatwave into ‘impossible’ territory.
This substantiates that, in addition to other processes, land–atmosphere interactions probably amplified the heating, especially where and when it was strongest (Extended Data Fig. 5), although further analysis is needed to link 850 hPa-level behaviour directly to surface processes. Meanwhile, many of the most extreme areas that plausibly experience land–atmosphere temperature amplification have experienced multi-decadal summer drying, warming and increasing temperature variability (Extended Data Fig. 6; Conclusions).
Furthermore, ongoing trends favour the nonlinear regional-mean behaviour amplifying this heatwave—thus, while the extreme heat of 2021 was unprecedented, it was nevertheless mechanistically linked to historical regional climate change.
This of course ignores the impact of changing land use on soil moisture trends, it ignores the probable influence of creeping urbanisation on recent (post 1960) warming trends and it ignores the influence of multidecadal natural variability affecting the Pacific Northwest region.
They used a model to assess the importance of land-atmosphere interactions upon extreme high temperatures.
Using a model experiment tailored to evaluate the role of soil moisture in climate, we determine that in the PNW, soil moisture–atmosphere interactions probably make monthly scale temperature extremes of the magnitude of June 2021 many times more likely.
Then what they do is construct a statistical generalised extreme value curve using the output from the model, rather than observations. Furthermore, they don’t use global mean surface temperature to ‘shift’ the distribution upwards, they use PNW mean surface temperature, which we might expect to be more significantly influenced by localised natural variability over the period in question, but which is nevertheless automatically attributed to ‘climate change’!
Consequently, the likelihood of the standardized temperature anomaly of June 2021 dramatically increases when soil moisture can interact with the atmosphere. We fit generalized extreme value (GEV) distributions to the yearly ensemble-maximum June mean temperature anomaly (Methods) of each ensemble, with their location parameters non-stationary in 5-year-smoothed annual PNW-mean surface temperature (PNWMST). We use PNWMST as a covariate instead of global mean surface temperature (GMST) to account for differing PNW-mean climate responses to global temperature between model configurations. Estimated empirical return periods are overlaid on the model curves, with each datapoint shifted in temperature by the dependence of the GEV location parameter on PNWMST. Fits and datapoints for each ensemble can thus be compared at a consistent baseline: at the observed PNWMST level of 2020, the GEV models estimate a ~400-fold increase (95% CI: 0.03–4,000,000) in the likelihood of the observed monthly anomaly of June 2021 between prescribed and interactive soil moisture ensembles, transforming it from an extremely unlikely ~500,000-yearly (~1,000–∞) event to a ~1,400-yearly (~150–∞) event.
Goodness me! Amazing! What was once an event not expected to occur more than once in half a million years has now become an event which is expected to recur every 1400 years. That’s pretty good going, but it’s still rare even in their shape-shifted land-atmosphere interacting climate. Too rare; they need it to be much more common in order to generate the necessary amount of public alarm about an event which probably has almost nothing to do with the ‘climate crisis’. So here’s where they really go to town on the ‘data’.
Increasing event likelihood driven by climate change
Recent climate change has rapidly increased the likelihood of the 2021 heatwave: over the past 70 years, such an event has multiplied in probability from virtually impossible to a multihundred-yearly event (Fig. 4). As above, we apply GEV analysis, a targeted approach for estimating extreme value statistics and an established method for attributing climate extremes to anthropogenic warming. We note that assessing the probability of this event in temperature alone—despite its multivariate extreme characteristics—probably conservatively estimates its increasing likelihood as a compound event, given simultaneous trends in other variables such as soil moisture.
Our Mission Impossible agents literally perform miracles in order to get the job done.
We apply GEV analysis to yearly-maximum June–August daily temperatures extending back to 1950, to maximize sample size and robustness, with both location and scale parameters non-stationary in 5-year-smoothed GMST (Methods). Results reveal drastic historical changes in heatwave probabilities: a hypothetical daily 8 °C regional temperature anomaly is estimated to have been virtually impossible in the 1950–1985 climate but has become an ~50-yearly event in the climate since 1986 (Fig. 4b). Similarly, the 2021 heatwave (an ~10.4 °C peak anomaly, far exceeding the historical range) was virtually impossible even at the average global temperature over 1986–2021 (return period 95% CI: 1,500–∞) but by 2021 has become a ~200-yearly event (25–∞)—thereby experiencing an infinite increase in probability (at least ~13-fold). Its probability increase since 1950–1985 is likewise infinite (at least ~500,000-fold). Furthermore, the probability of an event exceeding the magnitude of 2021 will increase rapidly under further increasing GMST—projected to recur ~10-yearly before 2050.
Bloody hell! Is that not scary enough for ya? There’s been an infinite increase in the probability of searing heatwaves just since 1985! The ‘climate crisis’ has changed the climate of the Pacific Northwest beyond all recognition basically (you could say it’s been FUBAR’d) – what once was impossible has now become possible and in a few more years, it will become routine. But they can only perform this miraculous ‘scientific’ feat by including the observed ‘impossible’ 2021 heatwave in their statistical calculations.
In including 2021, we follow refs. 45,46,49, assuming that the observation of 2021 is drawn from the same distribution as historical observations, since the study region was not selected solely to maximize local extremity but rather for a large-scale regional perspective, reducing (but not eliminating) selection bias. Alternatively, however, the excluding-2021 fit estimates a finite maximum possible temperature well below the 2021 observation even under current warming (Fig. 4b), questioning its validity. We note that the including-2021 fit is not rejected by a Kolmogorov–Smirnov test (Supplementary Figs. 9 and 10) despite its poor fit in similar analyses, which maintained a fixed scale parameter and analysed a smaller region more concentrated on the extreme. Ultimately, both fits underscore dramatic increases in heat-extreme probabilities resulting from gradual warming: in both, an ~1,000-yearly event in the 1950s would currently resemble an ~5-yearly event and has been surpassed many times (Fig. 4a). Furthermore, comparing future projections of a 2021-magnitude event, the fits roughly converge, both projecting <10-yearly recurrences by 2.5 °C GMST above pre-industrial temperatures. Notably, this threshold only increases to 2.75 °C GMST in a GEV fit with stationary instead of non-stationary scale parameters.
This is what their GEV fit including 2021 looks like:
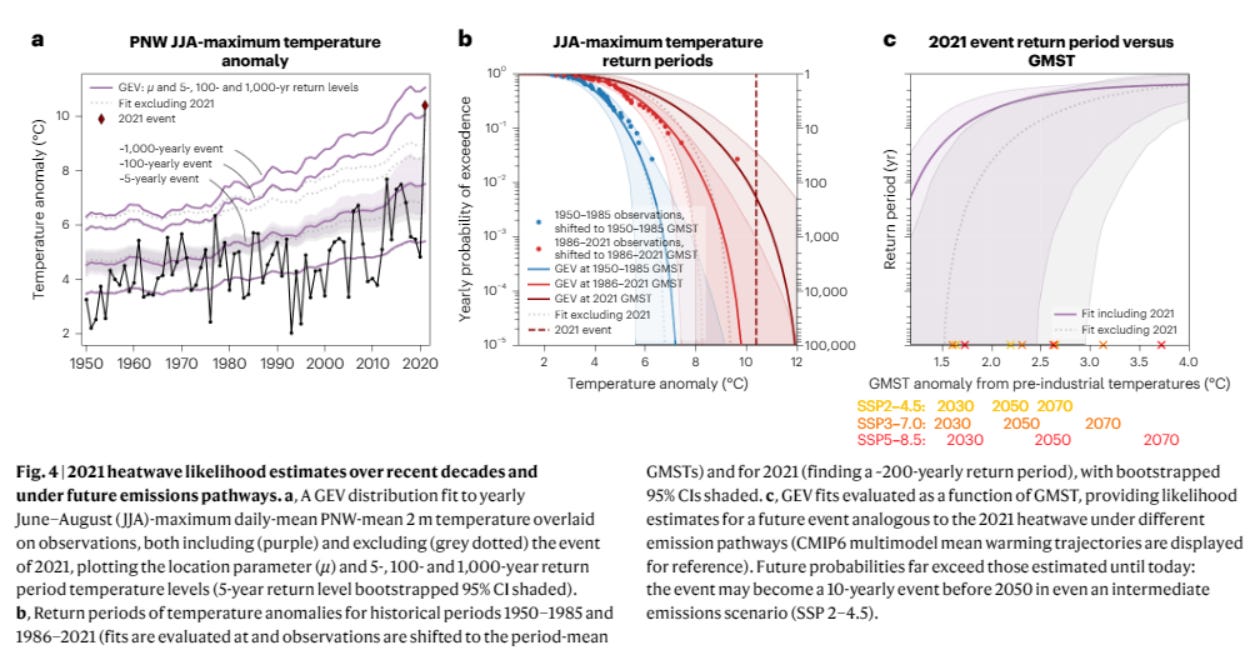
The red curve in fig b, which fits past observations, does not intersect the 2021 event (dashed line). Their new distribution, which includes 2021 (but fails to align with any previous observations) intersects the 2021 event at about 200 years, allowing the authors to make their wild claims above.
The authors conclude the following:
Notably, land–atmosphere coupling and temperature variability increases are strongest where soil moisture is climatologically moderate instead of the driest areas—thus, in the PNW, drying may increase temperature variability more than in already arid regions like the southwestern United States. In accordance with recent research demonstrating the emergence of heat-amplifying land–atmosphere feedbacks in regions not historically experiencing them and, moreover, projections of widespread mid century soil moisture regime shifts including the PNW37, we suggest that the 2021 heatwave may represent an alarming manifestation of a shifting regime across much of the PNW from wet to transitional climate, making such events more likely through strengthened soil moisture–temperature coupling—however, further research is required to substantiate this.
In a final part of this series, I’ll be looking at this claim.
")
")
")
")
")
")
")
")